So, you’re curious about moving to a new city like Penticton. Maybe you know Penticton well as a visitor, but what is it really like to live here year round? Is it an up-and-coming community with opportunities to open up your own business? Or is it sleepy? How do you make an informed decision?
Well, now you have the tools at your fingertips to do your own research. The City of Penticton’s new data portal presents all the statistics, provincial projections and local building and real estate statistics in one place, making it a fun activity to explore information that can help you draw your own conclusions.
So what can we learn from this data? Well, firstly, Penticton is growing! In 2022 we saw a net gain of 1.3% (or around 450 people) to our residential population. Our average household income is also growing, with a 25% increase in median income from the 2016 census. The data also shows that remote workers are, on average, earning 30% more than other workers.

We can see that more than half (56%) of our residents over the age of 15 are working in full or part-time jobs.
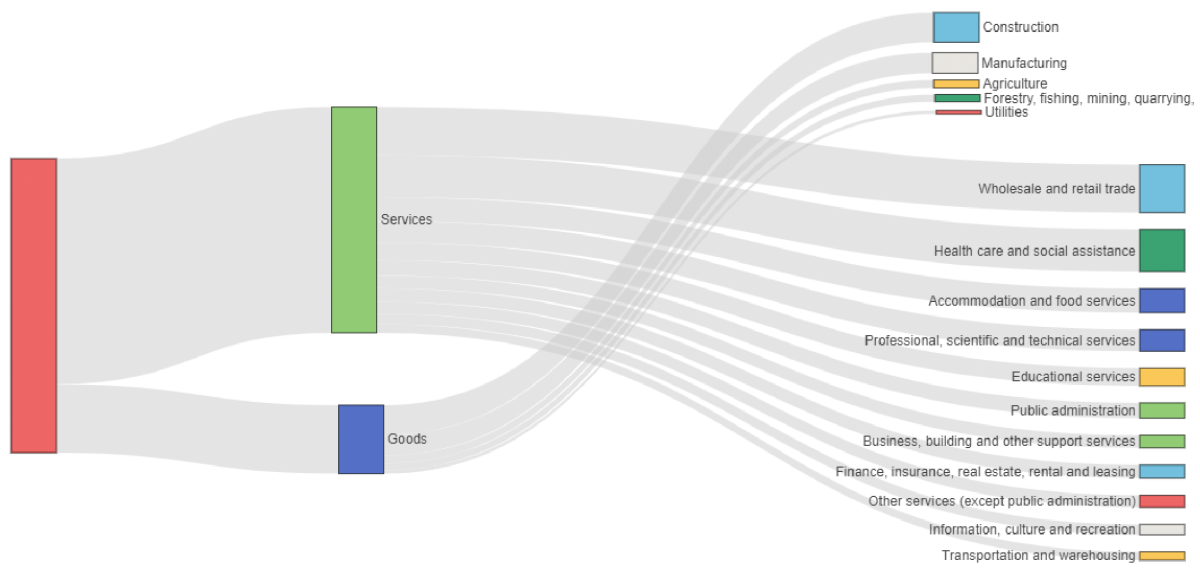
Looking regionally, our greatest areas of employment are health care and social assistance and wholesale and retail trade. But our businesses have been adding new jobs to the community in the goods and services sectors as well as professional, technical and scientific fields.
In Penticton, we have new businesses starting every year. In 2022 we had a total of 4,908 businesses (up 4.6% over the previous year), and 26% of those have employees. This employer information makes sense when you look at the main industry areas for these businesses being real estate, construction and professional, scientific and technical services - all sectors where solopreneurs and consultants are often found.

Embarking on a journey through Penticton's data is not merely a dive into numbers, but an exploration into a future home for prospective residents, entrepreneurs and community enthusiasts alike.
This isn’t just statistical navigation; it’s a key to unlocking a well-orchestrated, prosperous future in a new community. The data serves not just as figures, but as a guide, directing policies and initiatives towards a path that not only progresses Penticton’s unique aspirations and needs. For those contemplating a move, peering into the labour market outlook reveals a preview of sought-after occupations, paving a pathway towards a successful and thriving life in Penticton’s welcoming embrace.

And let’s not forget – data is a conversation starter, sparking community engagement and participation. It’s enjoyable to have current information about your home city and it can play into decisions you may make in work and life.
Check out this data portal - You can think of it like an open book, inviting community members to be co-authors in Penticton’s unfolding story, ensuring that the dialogue is not just inclusive but also rooted in facts and insights.
Follow Start Here Penticton on social


